FRAGTrack FIELD APP
- Orica
- Nov 4, 2025
- 4 min read
Orica’s innovative fragmentation measurement technology was been awarded a international Good Design Award in the engineering category, for outstanding design and innovation. read more
In my role as Experience Design Lead, I led the design of the FRAGTrack™ Field App, part of Orica’s BlastIQ™ digital platform—a suite of integrated technologies that empower better decision-making and greater control of blasting outcomes.
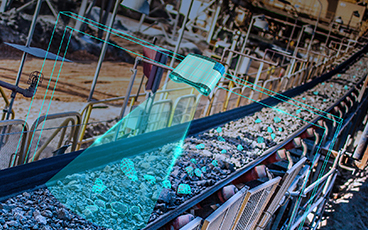
The FRAGTrack™ system automates the measurement of rock fragmentation, providing valuable data to optimise drill and blast operations. The Field App was designed to extend this capability into the field, giving technicians and BlastIQ™ Field Specialists a clear, real-time view of system status, preventative maintenance tools, and troubleshooting functions.
Adopting a service design approach, I worked closely with engineers, product managers, and end users to ensure the app fit seamlessly within the broader BlastIQ™ ecosystem. The goal was to create a succinct, one-page interface that communicated complex system information in under 30 seconds—supporting confident decision-making across all touchpoints in the service journey.
Below is a snapshot of the research, ideation, and application that shaped the user interface and experience.
BRIEF
It is to be condensed to a one page, uncomplicated view that will allow the user to get a full understanding of the system in less than 30 seconds. The Field App will be accessed via TeamViewer login, Wifi hotspot connection or direct LAN connection. The information displayed is to provide A FRAGTrack team member or BlastIQ Field Specialist a clear understanding of the system status and provide valuable information to assist in preventative maintenance and troubleshooting system faults. The Field App is also to provide the necessary tools to complete a system installation and in-field setup by trained technicians. The brief and requirements were based on feedback given on an existing product (seen below) used by real customers.


IDEATION
Based on the brief and requirements prepared by the Product Manager I put together a few sketches to get the conversation going and visualise my thoughts. It raised a lot of questions which allowed us to address them one by one before moving into a more high definition design.


HIGH DEFINITION MOCK-UP

Easy to use layout that features the different images available and the ability to navigate between them and perform some key functions.

Allowing the user to easily improve the quality of their images and thus improve the performance of the product was is one of the key objectives.

The dashboard assembles the status of the hardware as well as featuring the trigger settings that are also fundamental to performance. This space allows the user to quickly identify potential issues such a fan being off when temperature is high. It also alerts the user when the actual settings are outside of the threshold as seen here with the gate range being exceeded.
USABILITY TESTING RESULTS
A prototype was tested with 4 users that are already familiar with the current field device. The objective was to test the usability of a prototype when performing some key tasks. https://xd.adobe.com/view/93418695-b6cc-4ac0-bdef-3bacc6804fad-c612/?fullscreen&hints=off
Scenario given
As a FRAGTrack technician you have already performed a complete system installation and in-field setup for a customer. You are now interacting with the software to get an update of the System Status and perform a few actions that assist in preventative maintenance and troubleshooting system faults.
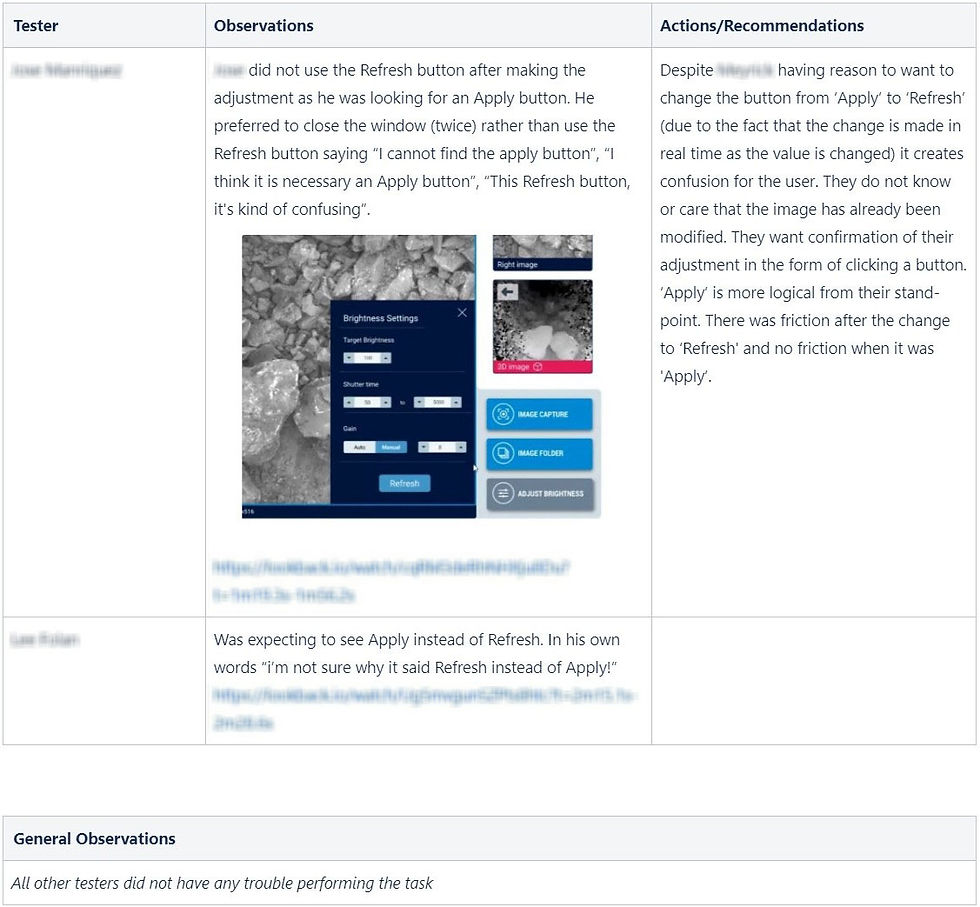
Task 1
GO INTO THE ADJUST BRIGHTNESS SETTING AND CHANGE THE GAIN FROM AUTOMATIC TO MANUAL. THEN CHANGE THE VALUE TO 8 USING THE ARROWS AND APPLY.
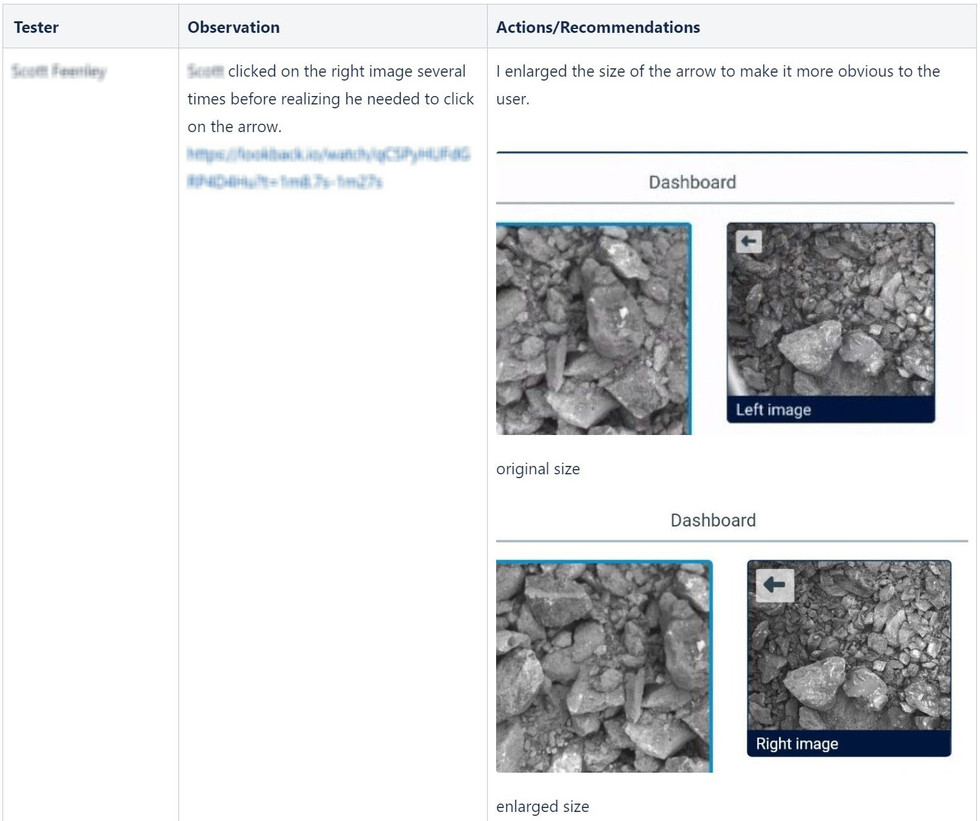
Task 2
TAKE AN IMAGE CAPTURE OF THE RIGHT IMAGE AND THEN FIND IT IN YOUR IMAGE FOLDER.


Task 3
GO BACK TO THE FIELD APP AND AUTO ENHANCE OF THE LATEST 3D IMAGE AVAILABLE

Task 4
NAVIGATE TO TRIGGER SETTINGS AND ADDRESS ANY ISSUES THAT MAY BE PRESENT.

Task 5
TALK ME THROUGH WHAT YOU SEE ON THE HARDWARE STATUS DASHBOARD. IS THERE ANYTHING CONCERNING THERE?

In Summary
The Field specialists were able to perform all the tasks we set for them despite some friction. Modifications were made as feedback came in allowing me to test the success of the improvements. In all cases the changes removed the flagged friction. One area for discussion is the naming of ‘dashboard’ as it was not obvious for two testers that Trigger settings would be found within. The other two testers found it straight away and all users found it eventually. Because this product will be mostly used repetitively it is debatable as to whether a change needs to be made, as once they have found it they will recall it’s location for future visits. The comment by G regarding the interactivity of the System status is not relevant at this point in time as the functionality is not available. It is also important to note that it was not expected by the other testers.
In general the Prototype was perceived as intuitive. Some of the feedback received by J was “great app, great great app”, “it is very intuitive”, “it’s really great, congratulations guys”.


Comments